
7YR企业会员
发布人:爱必信(上海)生物科技有限公司
发布日期:2026/6/16 14:18:50
肝外胆管癌(eCCA)恶性程度高、起病隐匿、易转移,一线化疗吉西他滨常因耐药失效。肿瘤微环境中癌相关成纤维细胞(CAFs) 如何驱动肿瘤进展与耐药?《Acta Pharmaceutica Sinica B》发表重磅成果,Absin 类器官 ATP 活力检测试剂盒全程支撑关键药敏实验,为临床联合用药提供精准转化依据。
文献标题:Targeting cancer-associated fibroblast-activated HGF/c-MET pathway inhibits extrahepatic cholangiocarcinoma progression and restores gemcitabine therapeutic sensitivity
发表期刊:Acta Pharmaceutica Sinica B (IF=14.6)
DOI:https://doi.org/10.1016/j.apsb.2026.02.023
使用 Absin 产品:Mouse TNF-α ELISA Kit(货号:abs50059)
研究团队构建eCCA 原代细胞 类器官 PDX一体化临床前平台,围绕三大科学问题层层递进:
1. CAFs 是否促进 eCCA 增殖、侵袭与吉西他滨耐药?
2. CAFs 分泌的关键效应因子是什么?
3. 靶向该因子通路能否逆转耐药、提升化疗效果?
关键模型与技术路线
● 样本:10 例 eCCA 临床组织,建立匹配CAFs、原代细胞、类器官(PDOs)、PDX 模型
● 机制:细胞因子芯片→锁定HGF→激活c MET/PI3K/AKT通路→驱动耐药
● 干预:c MET 抑制剂(JNJ 38877605 / 克唑替尼)+ 吉西他滨联合治疗
● 验证:2D 细胞、3D 类器官、动物模型三重佐证
● 体外:CAF CM 显著提升 eCCA 细胞增殖、迁移、侵袭能力
● 3D 类器官:CAFs 共培养使类器官数量与体积显著增加
● 体内:CAFs 共注射小鼠肿瘤生长更快、Ki 67 表达更高
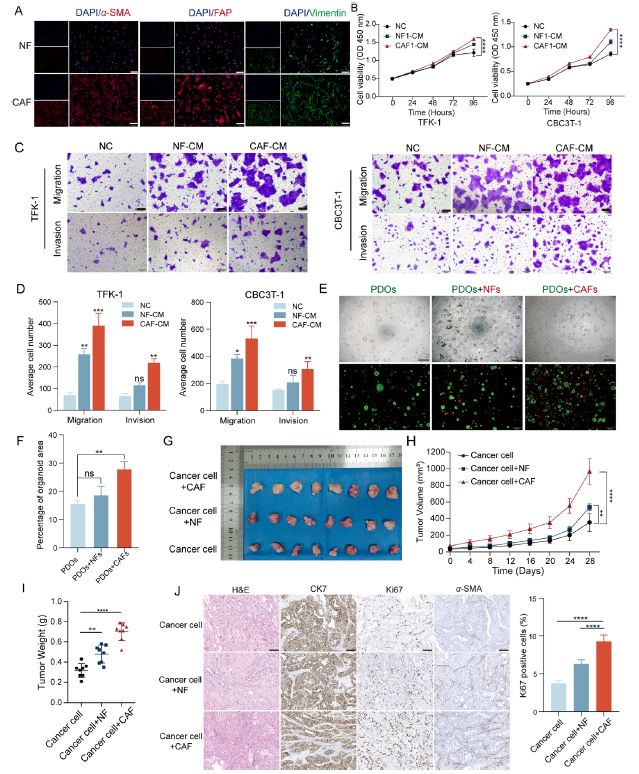
Figure 2 Effect of CAFs on eCCA progression. (A) Immunofluorescence staining of CAFs/NFs showed positive expression of α-SMA, Vimentin and FAP. Scale bar: 200 μm. (B) Effect of CAF-CM/NF-CM on proliferation of TFK-1 and CBC3T-1 cells. Negative control (NC) (n = 3). (C, D) Effect of CAF-CM/NF-CM on migration and invasion of TFK-1 and CBC3T-1 cells (n = 3). Scale bar: 200 μm. (E, F) Representative fluorescent images of PDOs monocultures or co-cultures with CAFs/NFs and quantitative analysis of total organoid area (n = 3). PDOs (green), CAFs/NFs (red). Scale bar: 200 μm. (G) Representative tumor images of cell-derived xenografts: cancer cells, cancer cells + NFs and cancer cells + CAFs. (H, I) Mean tumor volume and tumor weight (n = 8). (J) Representative images of H&E and IHC staining of α-SMA, CK7 and Ki67 (n = 8). Data are shown as mean ± SD. ns, no significance; *P < 0.05; **P < 0.01; ***P < 0.001; ****P < 0.0001.
● 细胞因子芯片显示:CAF CM 中HGF上调最显著
● ELISA 验证:CAFs 分泌 HGF 远高于正常成纤维细胞(NFs)
● 中和抗体实验:阻断 HGF 可逆转 CAFs 的促癌作用
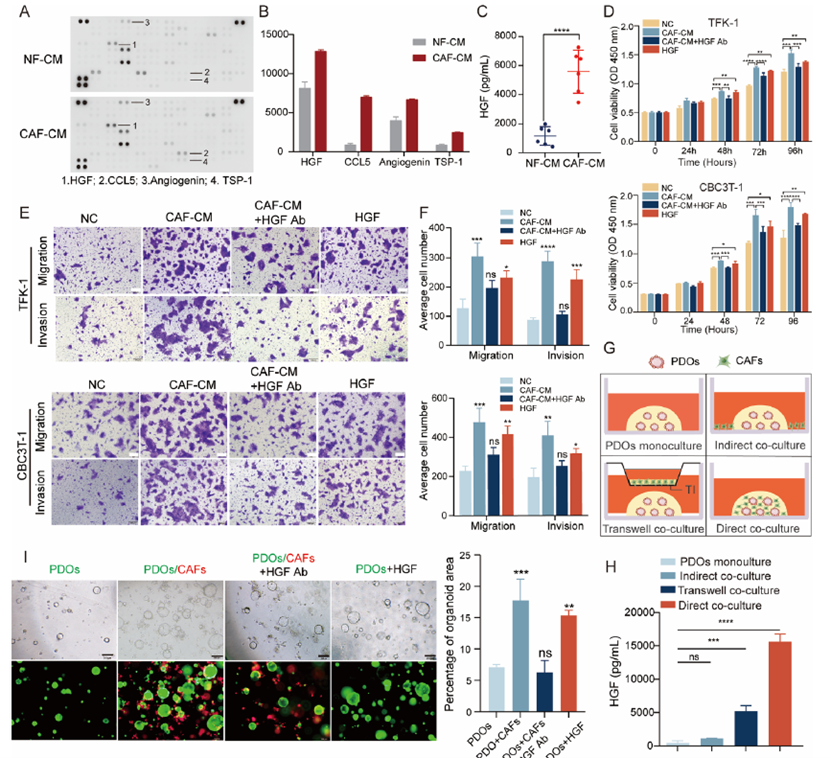
Figure 3 HGF is a key cytokine in CAF-CM affecting eCCA progression. (A, B) Cytokine expression of CAF-CM and NF-CM was detected by cytokine array. HGF, CCL5, Angiogenin and TSP-1 expression was significantly elevated. (C) Levels of HGF in conditioned media from CAFs and NFs derived from six patients with eCCA, measured by ELISA (n = 6). (D) Viability of eCCA cells under different treatment conditions-normal control (NC), CAF-CM, CAF-CM with HGF-neutralizing antibody (CAF-CM + HGF Ab), and recombinant HGF (HGF)―measured at 0, 24, 48, 72, and 96 h (n = 3). (E, F) Representative images of Transwell assay of eCCA cells treated with CAF-CM or CAF-CM + HGF Ab or HGF for 48 h (n = 3). Scale bar: 200 μm. (G, H) Schematic and ELISA-based quantitative analysis of HGF secretion in different co-culture models (n = 3): (i) PDO monoculture; (ii) indirect co-culture in which CAFs are seeded in the matrix surrounding PDOcontaining Matrigel; (iii) indirect co-culture using a Transwell insert (TI) to allow paracrine interaction without physical contact; (iv) direct co-culture in which PDOs and CAFs are co-embedded in Matrigel to allow cell—cell contact. (I) Representative fluorescence images of organoids in monoculture or direct co-culture with CAFs under different conditions and quantitative analysis of total organoid area (n = 3). Scale bar:200 μm. Data are shown as mean ± SD. ns, no significance; *P < 0.05; **P < 0.01; ***P < 0.001; ****P < 0.0001.
• HGF 结合 c MET,激活下游 PI3K/AKT 磷酸化
• 耐药细胞中 c MET 高表达,HGF 进一步降低吉西他滨敏感性
• 抑制 c MET 可阻断通路活化,恢复肿瘤对吉西他滨的响应

Figure 4 Inhibition of HGF/c-MET signaling pathway suppresses CAFs-induced eCCA progression. (A) Representative IHC images of c-MET expression in eCCA (n = 27) and para-tumor tissues (n = 9). (B) IHC staining intensity of c-MET in eCCA tissues (n = 27) and para-tumor tissues (n = 9) of TMAs. (C) Representative images of multiplex immunofluorescence staining (α-SMA, green; p-c-MET, yellow; CK19, red) in eCCA and para-tumor tissue. (D) Percentage of p-c-MET +CK19 +cells to CK19 +cells in eCCA tissues and para-tumor tissues. (E) Mean fluorescence intensity of α-SMA +in eCCA and para-tumor tissues. (F) Western blot analysis of p-c-MET, total c-MET, p-PI3K, total PI3K, p-AKT, and total AKT in TFK-1 and CBC3T-1 cells treated with recombinant HGF at different time points (15, 30, 60, 120 min). (G, H) Western blotting of the c-MET/PI3K/AKT signaling pathway in TFK-1 and CBC3T-1 cells under the following conditions: normal control (NC), CAFCM, CAF-CM supplemented with an HGF-neutralizing antibody (CAF-CM + HGF Ab), or recombinant HGF (n = 3). (I, J) Western blot analysis of c-MET/PI3K/AKT pathway activity in eCCA cells treated with CAF-CM, with or without the c-MET inhibitors JNJ-38877605 or crizotinib (n = 3). Data are shown as mean ± SD. *P < 0.05; **P < 0.01; ***P < 0.001; ****P < 0.0001.
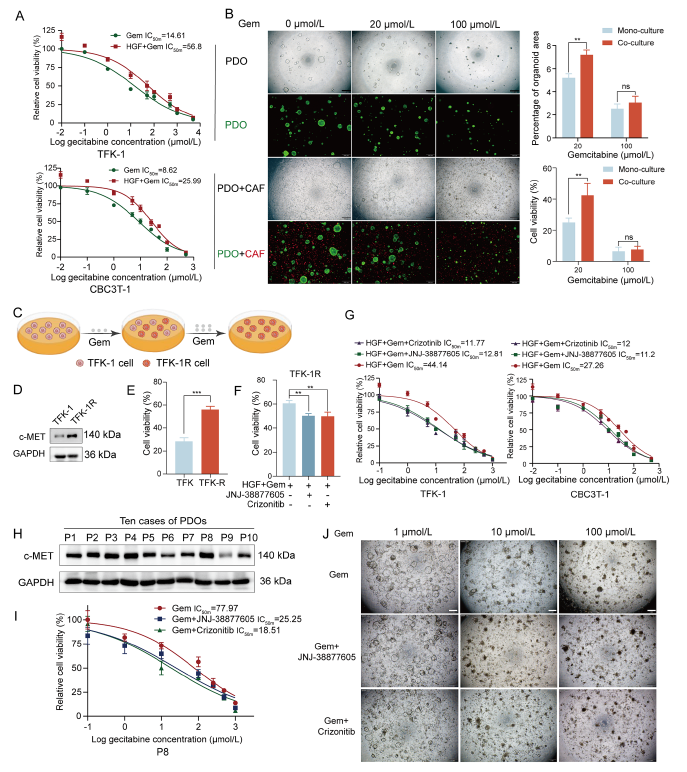
Figure 5 Targeting the HGF/c-MET signaling pathway enhances gemcitabine treatment sensitivity in vitro. (A) Cell viability of TFK-1 and CBC3T-1 cells treated with gemcitabine or gemcitabine combined with HGF (n = 3). (B) Representative images of the sensitivity of gemcitabine to PDOs monoculture systems or direct co-culture systems with CAFs (n = 3). PDOs (green), CAFs (red). The percentage of total area of the PDOs was quantified and the viability was determined. Scale bar: 500 μm. (C) Schematic diagram for the construction of TFK-1 gemcitabineresistant cells (TFK-1R). (D) Western blot analysis of c-MET protein levels in parental TFK-1 cells and gemcitabine-resistant TFK-1 cells (TFK-1R). (E) Cell viability of 100 μmol/L gemcitabine-treated TFK-1 and TFK-1R cells (n = 3). (F) Cell viability of TFK-1R cells treated with 100 μmol/L gemcitabine or in combination with c-MET inhibitor under conditions of added HGF (n = 3). (G) Dose—response curves of gemcitabine alone or in combination with c-MET inhibitors for treatment of TFK-1 and CBC3T-1 cells under conditions of added HGF (n = 3). (H) Western blot analysis of c-MET protein levels in PDOs established from 10 cases of eCCA. (I, J) Representative images and dose—response curves of gemcitabine alone or in combination with c-MET inhibitor in a direct co-culture system of PDOs and CAFs. Patient 8 (P8) (n = 3). Scale bar: 500 μm. Data are shown as mean ± SD. ns, no significance; **P < 0.01; ***P < 0.001.
• 吉西他滨单药效果有限,联合 c MET 抑制剂显著抑瘤
• 类器官药敏与 PDX 药效高度一致,支持临床转化
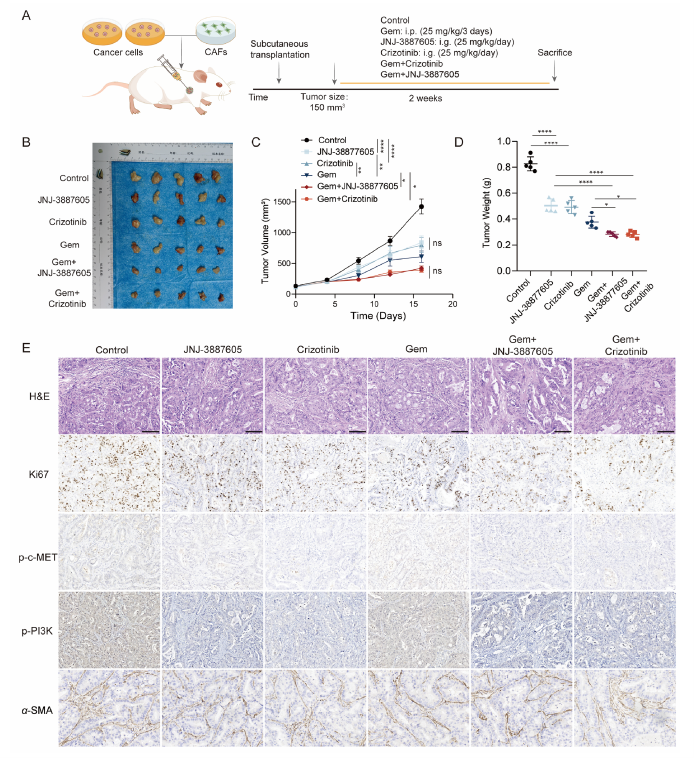
Figure 6 The combination of gemcitabine and c-MET inhibitors reduced cell-derived xenotransplantation growth. (A) Schematic diagram of he process of co-injection of cancer cells and CAFs into mice subcutaneously. (B—D) Representative tumor images of cell-derived xenografts treated with gemcitabine, c-MET inhibitors, or gemcitabine combined with c-MET inhibitor. Tumor volume and mass were calculated (n = 5).(E) H&E and IHC staining were used to assess the expression of Ki67, p-c-MET, p-PI3K and α-SMA in subcutaneous tumor tissues of mice. i.p., intraperitoneal injection; i.g., intragastric. Scale bar, 100 μm. Data are shown as mean ± SD. ns, no significance; *P < 0.05; **P < 0.01;****P < 0.0001.
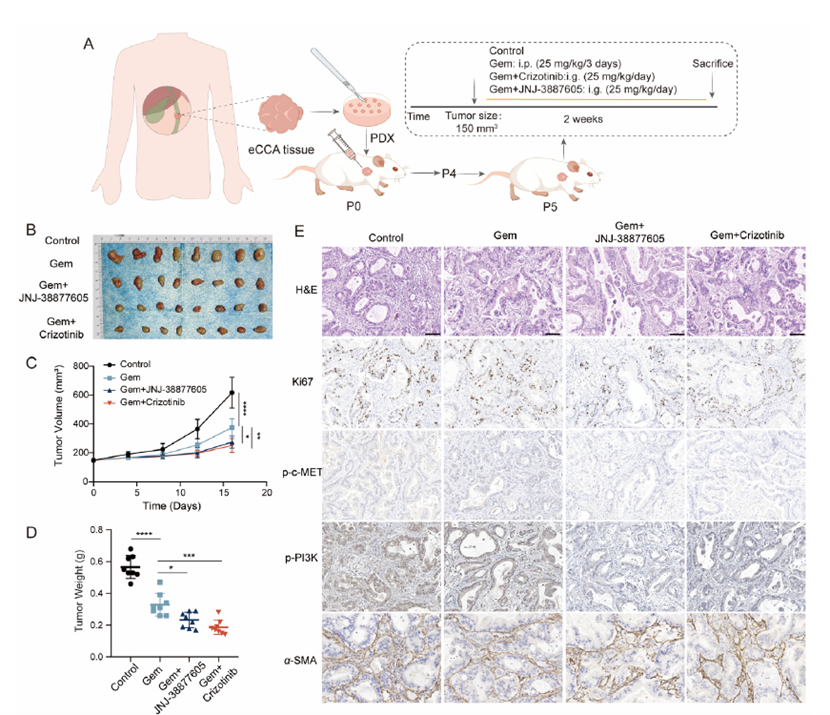
Figure 7 The combination of gemcitabine and c-MET inhibitors reduced PDX tumor growth. (A) Schematic diagram of the PDX model construction process used for screening drugs. Passage 0 (P0), passage 4 (P4), passage 5 (P5). (B) Representative tumor images of PDX treated with gemcitabine alone or gemcitabine in combination with c-MET inhibitors. (C, D) Tumor volume and mass statistics (n = 8). (E) H&E and IHC staining were used to assess the expression of Ki67, p-c-MET, p-PI3K and α-SMA in PDX tissues. Scale bar, 100 μm. Data are expressed as mean ± SD. *P < 0.05; **P < 0.01; ****P < 0.0001.
✅ 实验场景(原文 2.12/Fig.5I J/Fig.5B)
• PDOs 与 CAFs3D 直接共培养药物敏感性检测
• 吉西他滨单药 / 联合 c MET 抑制剂的类器官活力定量
• 高通量、精准评估3D 模型中肿瘤细胞存活与药物响应
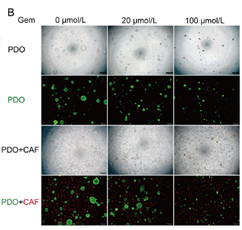
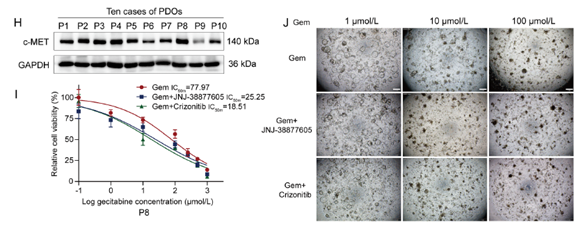
Figure 5 Targeting the HGF/c-MET signaling pathway enhances gemcitabine treatment sensitivity in vitro. (B) Representative images of the sensitivity of gemcitabine to PDOs monoculture systems or direct co-culture systems with CAFs (n = 3). PDOs (green), CAFs (red). The percentage of total area of the PDOs was quantified and the viability was determined. Scale bar: 500 μm.(I, J) Representative images and dose—response curves of gemcitabine alone or in combination with c-MET inhibitor in a direct co-culture system of PDOs and CAFs. Patient 8 (P8) (n = 3).Scale bar: 500 μm. Data are shown as mean ± SD. ns, no significance; **P < 0.01; ***P < 0.001.
✅ 产品核心价值
1. 3D 场景专属优化
裂解液高效穿透基质胶与类器官致密结构,避免活细胞漏检
2. 高灵敏发光法
ATP 含量与活细胞数线性相关,微量样本即可准确定量
3. 操作极简
加样 孵育 读数,适配高通量筛选,大幅提升实验效率
4. 数据稳定可靠
为类器官药敏提供标准化、可重复的定量依据
本研究首次在eCCA 亚型中证实:
• CAFs 通过HGF/c MET通路驱动肿瘤进展与吉西他滨耐药
• c MET 抑制剂 + 吉西他滨是极具潜力的联合治疗方案
• 类器官 + PDX 平台可高效预测临床药效,推动精准治疗
Absin 以高性能试剂助力肿瘤微环境与耐药机制研究,为胆管癌等恶性肿瘤临床转化提供硬核支撑。
相关新闻资讯